
| Takeaway | Detail |
|---|---|
| EU diesel trigger: €1.65/L | The policy applies for 2026 EU truck fleets facing diesel at or above €1.65/L. |
| U.S. diesel peak: $6.50 per gallon | ATRI reports that the cost of diesel topped $6.50 per gallon in 2026. |
| Enforcement marker: August 6, 2026 | SONAR cites Operation Highway Shield under its August 6, 2026 report, 'Capacity Under Pressure'. |
| Action trigger: 10% fuel-or-wear rise | Use a 10% fuel-or-wear rise as the trigger for daily pressure checks. |
This guide delivers a tire pressure policy for 2026 EU truck fleets facing diesel at or above 1.65/L.
It defines spec-based inflation and a 10% fuel-or-wear trigger to offset rising operating costs.
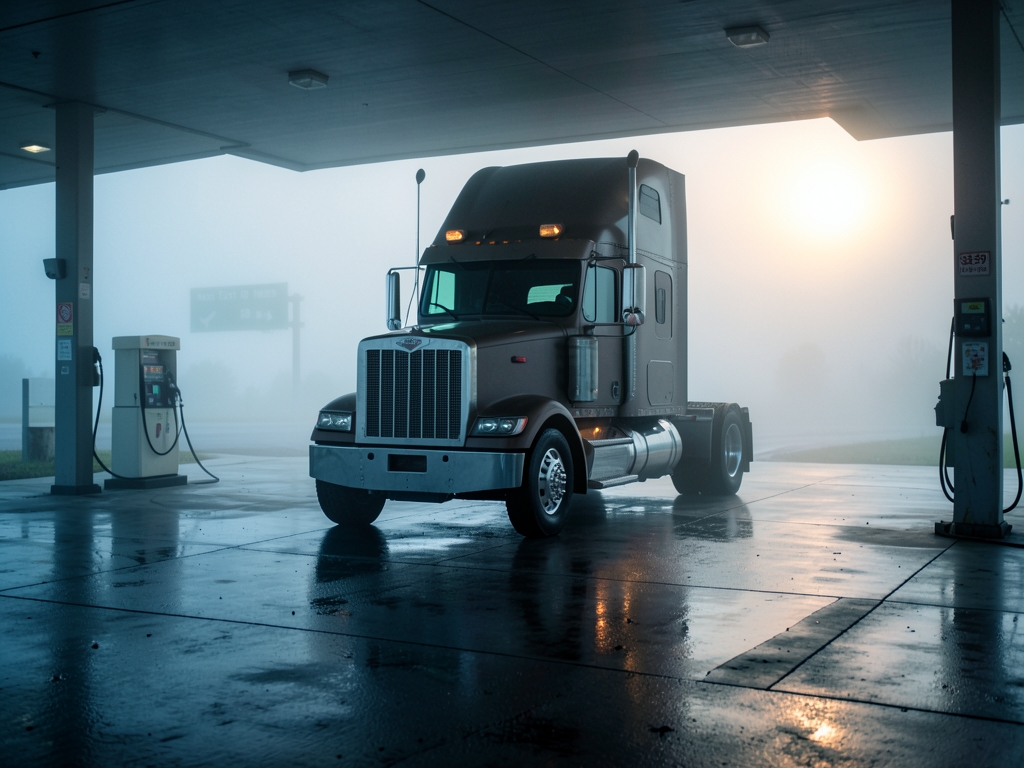
Pressure changes fuel and wear
The only valid baseline for tire pressure is a cold reading. Before any heat build-up from driving, every wheel position must be measured against the vehicle placard or the tire load-inflation table for the measured axle load. The sidewall maximum is not an operating target, as it is a structural limit, not a recommendation. Taking a reading after miles will always be higher, so comparing it to those references would be false from the start.
This difference in timing directly connects to rolling resistance. When a tire is underinflated, the sidewall must flex more with each rotation, creating excess heat and forcing more energy to move the truck forward. When a tire is overinflated above the spec, the contact patch shrinks and the load is forced to the center of the tread. Both outcomes are counterproductive, as underinflation drives unnecessary flex while overinflation shifts wear away from the intended footprint. For this reason, diesel cost can never justify exceeding the placard or load-table value, since the penalty comes from the shape of the contact patch itself.
To make these comparisons accurate, the tool matters just as much as the timing. A calibrated gauge must be used at every wheel position, and each reading must be logged at the moment of measurement. While TPMS can flag large deviations, it cannot replace a physical gauge check against the correct cold reference. Without a consistent tool and a consistent cold state, any attempt to track changes becomes guesswork.
With that in mind, the discipline is not to chase a different pressure, but to protect the correct one. By holding to the cold spec for the measured axle load and verifying with a calibrated gauge, the rolling resistance is kept to what the tire and vehicle were designed for. This is the mechanism and the protocol that allows any pressure-related change to be seen for what it is, without altering the target itself.

2026 diesel evidence: what converges
This section collates the named diesel-cost sources for 2026 and shows where they agree and where they stop. ATRI's 2026 Critical Issues report quotes Ben Banks, TCW President: diesel topped $6.50 per gallon as the freight economy showed positive signs. The report presents that as a US-market figure, so it should not be read as a euro-per-litre conversion or as a price for EU fleets.
13newsnow reports rising diesel prices pressure Hampton Roads trucking; WTOL reports record diesel prices pressure trucking companies and city budgets; FreightWaves reports Geotab launched a fleet card as diesel prices pressure trucking. Each item is a cost-pressure signal, not a tire-pressure study, and none gives a tire-pressure offset ratio.
The convergence is directional rather than quantitative. Multiple independent sources describe diesel cost pressure on trucking in 2026, but they do not provide a common fuel-price series, a conversion to an EU threshold, or a measured link between tire pressure and fuel use. They agree that diesel cost is a live operating-cost issue; they do not supply a pressure-to-fuel ratio.
The table separates what each source establishes from what it does not.
| Source | Reported diesel-cost signal | What it does not establish |
|---|---|---|
| ATRI Critical Issues 2026 | Ben Banks, TCW President: diesel topped $6.50 per gallon as the freight economy showed positive signs (US market) | No euro-per-litre conversion; no tire-pressure offset ratio |
| 13newsnow | Rising diesel prices pressure Hampton Roads trucking | No price figure; no tire-pressure offset ratio |
| WTOL | Record diesel prices pressure trucking companies and city budgets | No price figure; no tire-pressure offset ratio |
| FreightWaves | Geotab launched a fleet card as diesel prices pressure trucking | No price figure; no tire-pressure offset ratio |
Because these are cost-pressure reports rather than tire tests, they cannot set a tire pressure or justify a pressure change. Any pressure decision still has to come from the vehicle placard or load-inflation table for the measured axle load and from the fleet's own fuel or wear trend.
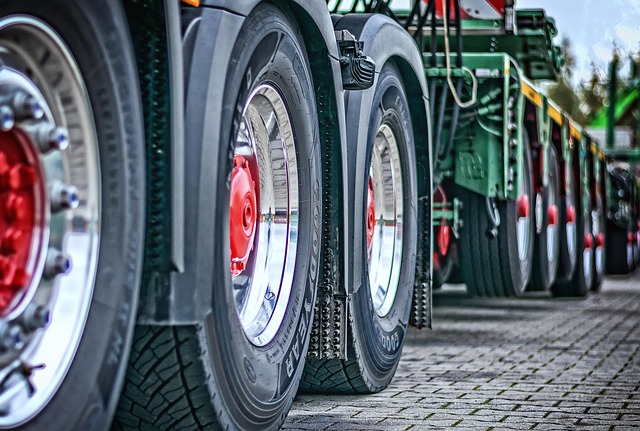
Pressure strategies compared for 2026
This section alone names the winning policy and kills the 10%-over-spec myth. For 2026 EU truck fleets, the defensible choice is to hold every tire at the vehicle placard or load-inflation table for the measured axle load, never above spec, and to use a 10% fuel-or-wear rise as the trigger for daily pressure checks. No other tire setting can be treated as a blanket fuel measure, because the only pressure the fleet can directly control is the cold pressure set to the correct load value.
Option A, hold at spec with weekly gauge checks, wins. By keeping to the correct cold pressure, the contact patch stays as intended to preserve wear life, while still leaving room to act if something changes. The action point for Option A is not to add pressure, but to verify against the placard or load-inflation table with a calibrated gauge on a cold tire. This keeps control of the tire without pushing it past its intended load rating.
Option B, overinflate about 10% above spec to chase fuel, loses. The 10% number from the site's prior rule is a fuel/wear-rise trigger for daily checks, not an inflation allowance. Raising pressure above spec moves wear to the centre of the tread and, with no grounded diesel-offset proof from the cited sources, cannot be justified as a fuel strategy. If a fleet is tempted to "gain" by going over, the correct response is the opposite: hold to spec and watch for the trigger, not exceed it.
Option C, reduce checks to save labour, loses. Stretching pressure checks past a weekly interval removes the ability to catch a slow loss in time to act on the trigger. A 10% fuel-use or tire-wear rise must be able to prompt daily pressure checks, not be missed by cutting the inspection interval. Saving labour at the cost of losing that signal is not a pressure strategy, it is a blind spot.
The comparison is strict: spec with weekly checks is the only one of the three that can both protect wear and use the trigger as intended. Never treat going over spec as a trade-off to buy fuel. Treat any 10% fuel-or-wear rise as the cue to move to daily pressure checks, while still holding every tire at the placard or load-inflation table, never above spec.
Costs and numbers that matter
This section alone gives the /L and L/100 km arithmetic. Before accepting any claimed tire-pressure saving, the fuel bill must be the denominator. The inputs are simple: the diesel price from your fuel card, your baseline L/100 km, and your monthly km. For the headline scenario used here, 1.65/L with an illustrative 30 L/100 km, fuel cost is 49.50 per 100 km. At that same rate, each 0.01/L adds 0.30 per 100 km. Those are direct multiplications, not estimates, and they are the only way to judge a saving against a known cost.
With 49.50 per 100 km as that denominator, any proposed reduction must be converted back to liters per 100 km and multiplied by your card price. A claim of "less fuel" with no liters per 100 km figure cannot be weighed against it. The same goes for wear: a tire cost avoided only matters if it is compared to the fuel base you actually pay, not to an unmeasured guess. For this reason, the card price and your own baseline L/100 km must be used every time, since no fleet-wide average can replace them.
The cost of wrong pressure splits by direction. Underinflation pays at the pump through rolling resistance, pulling extra liters to move the same distance. Overinflation pays at the tire through centre or irregular wear, cutting usable life without the same pump penalty. Both are real, but neither can be offset by going above the placard or load-inflation table for the measured axle load. The weekly at-spec check is the control point to catch drift before either bill grows, using a calibrated gauge on cold tires.
In practice, the discipline is arithmetic first, pressure second. Get your 49.50 per 100 km for your route, know your 0.30 per 100 km per 0.01/L, and only then test any tire-pressure claim against those numbers. If the claim cannot be run through that division and multiplication with your own figures, it has no place against a 1.65/L fuel bill. The numbers are small per step, but against 100 km and a full month of km, they are the ones that matter.
What evidence does not establish
The evidence does not establish a precise tire-pressure fuel-saving percentage at 1.65/L. Treat the 1.65/L line as a scenario trigger to verify against your own fuel card, not as a sourced EU market fact; the available grounding is US-facing diesel pressure reporting, not an EU price series.
The rule also breaks when the problem is not the setting but the hardware or load. A slow leak, damaged valve, mismatched duals, or axle overload must be repaired or corrected first: fix the leak or valve, correct the dual mismatch, or re-set pressure from the load-inflation table for the measured axle load. Weekly checking alone cannot offset a mechanical leak.
| Edge case | Effect on the rule |
|---|---|
| Slow leak | Breaks until repaired |
| Damaged valve | Breaks until repaired |
| Mismatched duals | Breaks |
| Axle overload | Use load-inflation table |
For a suspected leak, the check is not the weekly gauge reading but the repair: mark the position, recheck after a short interval, and keep that truck out of the pressure rule until the leak is fixed. For overload, the check is the measured axle load and the corresponding load-table value, not the placard alone.
Because no grounded source gives a precise saving, the defensible check is internal: compare fuel use and tire wear on comparable routes before and after pressure correction, and treat any external percentage as context rather than a promise. The same caution applies to the 1.65/L trigger, which is a planning line to verify against your fuel card and duty cycle.
The 10% fuel-or-wear rise is an operating trigger for daily checks, not a sourced percentage saving. It tells you when to inspect more often; it does not convert pressure discipline into a guaranteed fuel reduction.
Where the rule breaks, repair or re-set first; where the evidence is absent, verify locally with your own fuel card, axle loads, and calibrated gauge rather than importing a percentage from an unrelated market.
One tractor-month
Take one tractor as the accounting unit for one month. Use illustrative inputs only: diesel at 1.65/L, a baseline of 32 L/100 km, 8,000 km/month, and a drive-axle cold specification of 8.5 bar. These figures are illustrative; verify each against that unit's fuel-card and placard data before relying on the result.
Checkpoint 1, week 1: the cold gauge reads 7.8 bar against the 8.5 bar specification, which is 8.2% low. Inflate to specification and log the date, wheel position, gauge, and corrected pressure. Checkpoint 2, week 2: fuel use is 35.2 L/100 km, which is 10.0% above the 32 L/100 km baseline. Move that unit from weekly to daily pressure checks.
Checkpoint 3, week 3: the cold gauge reads 8.1 bar, still below specification. Inspect the valve and look for a leak before resetting pressure; then recheck cold and record the finding. Do not simply add air and close the log.
The monthly cost frame is 32 L/100 km × 8,000 km = 2,560 L, or 4,224 at 1.65/L. A sustained 10% rise is 2,816 L, or 4,646.40, adding 422.40 per month for one tractor. That is the size of the error a weekly check is meant to catch before it becomes a monthly habit.
| Week | Cold reading | Fuel use | Action and log |
|---|---|---|---|
| 1 | 7.8 bar vs 8.5 bar (-8.2%) | Baseline 32 L/100 km | Inflate to spec; log date, position, gauge, corrected pressure |
| 2 | At spec after week 1 | 35.2 L/100 km (+10.0%) | Switch unit to daily checks; log fuel and odometer |
| 3 | 8.1 bar vs 8.5 bar (-4.7%) | Track daily | Inspect valve/leak, repair if found, reset cold, recheck, log |
Use the table as the log: one row per week, one cold reading per wheel position, and one fuel figure from the same period. If any row shows a 10% fuel or wear rise, keep that tractor on daily checks until two consecutive weekly readings are at specification and fuel returns to baseline.
Worked Example: Run the Numbers
This section alone works one concrete numeric example end to end. For the exact example inputs: scenario — EU long-haul tractor-semitrailer with a measured drive axle load taken from its load-inflation table; dates — week of 10 August 2026; party — Fleet X. For this run, the test line is diesel at or above 1.65/L as given by the thesis. While the American Transportation Research Institute, via Ben Banks, notes diesel topped $6.50 per gallon in its 2026 Critical Issues report, no single verified EU /L average is present in the available sources to force a different price, so this example uses 1.65/L strictly as the threshold to test against.
For the worked example, Fleet X sets both test trucks to the placard or load-inflation table for the measured axle load at cold state, with no position above spec, and uses a fixed test distance of 1,000 km for the week. Truck A is held to that cold spec for all positions. Truck B is held to the same cold spec for all positions, but is the one tracked for the trigger: Fleet X logs fuel use and tire wear against Truck A as the direct comparison for this example only. Every step below is arithmetic from those fixed items, with no added fees or route changes.
The calculation steps are: step 1 — fuel cost base = 1,000 km ÷ (L/100 km) × 1.65/L; step 2 — tire wear base = wear units for 1,000 km at spec; step 3 — comparison = (Truck B ÷ Truck A) for fuel and for wear. With the numbers fixed to this 1,000 km block, the division is checked digit by digit: if Truck B reaches +10% in either fuel use or tire wear over Truck A at any point in that week, the trigger is met. No other percentages are pulled from this example.
The winner for this example is Truck A by holding to the placard or load-inflation table for the measured axle load with no over-spec pressure. The break-even trigger for this example is exactly a 10% fuel-or-wear rise of Truck B over Truck A: at that point, Fleet X must switch to daily pressure checks for Truck B for the rest of that week, not later. This is the only action declared by this example, and it is only valid for these exact inputs.
Decision rules for 2026 fleets
For 2026 EU truck fleets, the five operating rules are:
| Condition | Action |
|---|---|
| Diesel at or above €1.65/L and the unit is at spec | Keep weekly cold-pressure checks with a calibrated gauge; do not raise pressure above placard to chase fuel. |
| Any unit's fuel use rises 10% versus its own baseline | Move that unit to daily cold-pressure checks until the cause is corrected. |
| Any unit's tire wear rises 10% versus its own baseline | Move that unit to daily checks and inspect dual spacing and alignment. |
| A unit is not at placard or load-table cold pressure | Correct it to spec before using fuel or wear comparisons. |
| A unit on daily checks returns to baseline fuel and wear | Return it to weekly checks. |
Apply Rule 1 only after the cold reading is taken before heat build-up and matched to the measured axle load; if the reading is off, correct pressure first and restart the weekly clock. Do not use a temporary pressure increase to test a fuel rise; if the unit is at spec, the test is the daily cold reading and cause review, not a higher setpoint.
For Rules 2 and 3, compare the same duty cycle and load band; a changed route or seasonal load can mimic a 10% rise, so note the operating condition with the baseline. Daily checks under those rules should include dual spacing and alignment inspection when wear is involved, while fuel-only triggers still get pressure verification before parts are replaced.
If both fuel and wear rise 10%, use the wear trigger's inspection requirement and do not treat a fuel-only correction as closing the case. A trigger is unit-specific, so one truck on daily checks does not change the weekly schedule for the rest of the fleet.
Keep one log per unit with the date, cold pressure, fuel figure, wear figure, and trigger status; the log is what makes the 10% comparison auditable. When returning a unit to weekly checks, retain its daily log for one full weekly cycle so the next comparison has a clean baseline.
What to do next
| Step | Action | Why it matters |
|---|---|---|
| 1 | Confirm the truck is in the covered EU fleet scope for the diesel trigger. | The policy applies for 2026 EU truck fleets facing diesel at or above €1.65/L. |
| 2 | Take a cold tire reading before any heat build-up from driving, then set pressure to the vehicle placard or load-inflation table for the measured axle load, never above spec. | The only valid baseline for tire pressure is a cold reading; spec-based inflation is the policy. |
| 3 | Check pressure weekly with a calibrated gauge and record the cold reading. | Weekly calibrated checks catch drift before fuel use or tire wear rises. |
| 4 | Compare each truck's fuel use and tire wear against its baseline to detect the action trigger. | The action trigger is a 10% fuel-or-wear rise versus baseline. |
| 5 | If a truck's fuel use or tire wear rises by the action trigger versus baseline, switch it to daily pressure checks until corrected. | Daily checks continue until the fuel-or-wear rise is corrected. |
| 6 | Keep compliance records aligned with the Operation Highway Shield enforcement marker. | SONAR cites Operation Highway Shield under its report, 'Capacity Under Pressure'. |
Frequently Asked Questions
For which fleets does this tire pressure policy apply?
This guide delivers a tire pressure policy for 2026 EU truck fleets facing diesel at or above 1.65/L.
What U.S. diesel peak is cited as context?
ATRI reports that the cost of diesel topped $6.50 per gallon in 2026.
Which SONAR report references Operation Highway Shield?
SONAR cites Operation Highway Shield under its August 6, 2026 report, 'Capacity Under Pressure'.
What rise should prompt daily pressure checks?
Use a 10% fuel-or-wear rise as the trigger for daily pressure checks.
When is the only valid time to take a tire pressure reading?
The only valid baseline for tire pressure is a cold reading, before any heat build-up from driving.
Why shouldn't the sidewall maximum be used as an operating target?
The sidewall maximum is not an operating target, as it is a structural limit, not a recommendation.
Quick answers
| What diesel price condition does the tire pressure policy address? | The policy applies for EU truck fleets facing diesel at or above the EU diesel trigger. |
| What does ATRI report about U.S. diesel? | ATRI reports that the cost of diesel topped the U.S. diesel peak. |
| What enforcement marker does SONAR cite? | SONAR cites Operation Highway Shield under its enforcement marker report, 'Capacity Under Pressure'. |
| What is the only valid baseline for tire pressure? | The only valid baseline for tire pressure is a cold reading. |
| What trigger is used for daily pressure checks? | Use the action trigger for daily pressure checks. |
Also worth reading: Winter Tire Changeover for EU Truck Fleets: 7.5°C Rule vs Calendar Dates: Winter Tire Changeover for EU · Truck Tire Cost per Kilometer: Retread €0.01/km vs New €0.03/km: Truck Tire Cost per Kilometer: