
| Takeaway | Detail |
|---|---|
| A 10% fuel-use increase triggers daily pressure checks. | Compare each truck’s fuel consumption with its baseline; a 10% rise means moving from weekly to daily checks until the cause is corrected. |
| A 10% tire-wear increase triggers daily pressure checks. | Compare tire wear with the truck’s baseline; a 10% rise means moving from weekly to daily checks until the cause is corrected. |
| Daily checks continue until the trigger is resolved. | Keep checking tire pressure daily while investigating and correcting the fuel-consumption or tire-wear increase. |
| Never reduce tire-pressure check frequency. | A 10% rise is a diagnostic signal of possible pressure loss, not a reason to perform fewer checks. |
This guide explains when a truck’s 10% fuel-consumption or tire-wear increase should trigger more frequent tire-pressure checks. It establishes a clear rule: move from weekly to daily checks until the cause is identified and corrected, and never reduce check frequency.
How Underinflation Drives the 10% Signal
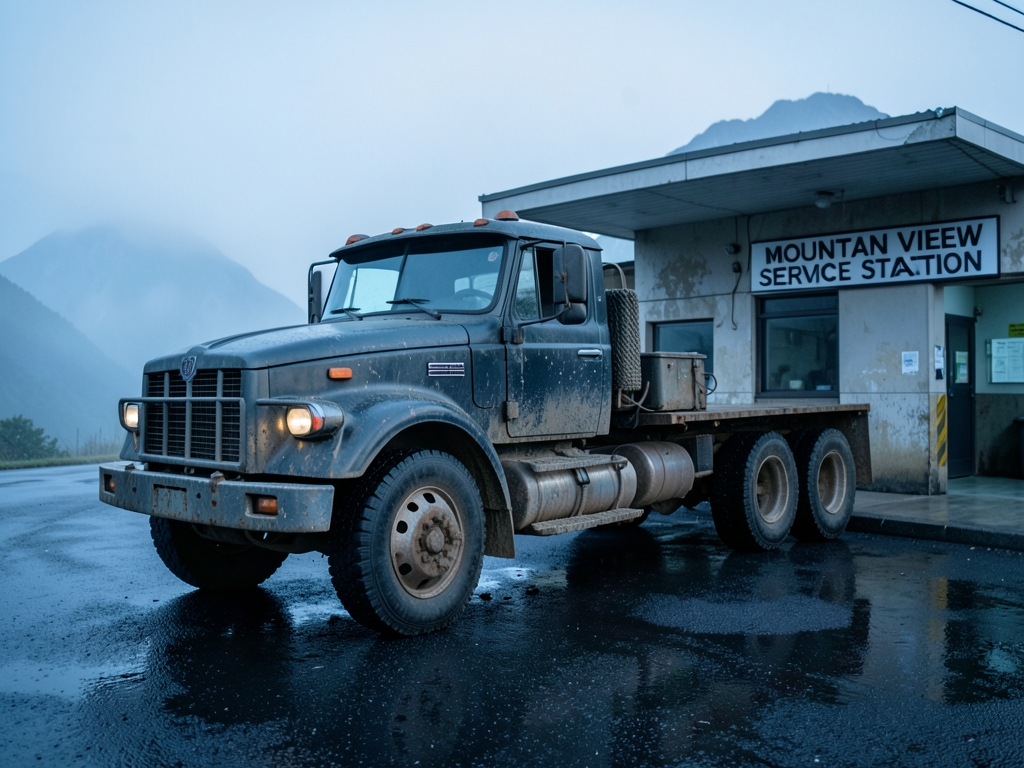
Underinflation is a physical problem before it is a maintenance schedule problem. As a tire loses air, its sidewalls flex more as the vehicle rolls, creating greater deformation and heat. That increases rolling resistance, so the engine must burn more fuel to move the truck. The article's cited tire-manufacturer benchmark is that a 10% underinflation raises fuel consumption by 1.5–2% and reduces tire life by 10–15%. Because trucks have multiple tires and axles, the effects can compound across the vehicle, so a fuel or wear change should be checked against the truck's own baseline before any conclusion is drawn.
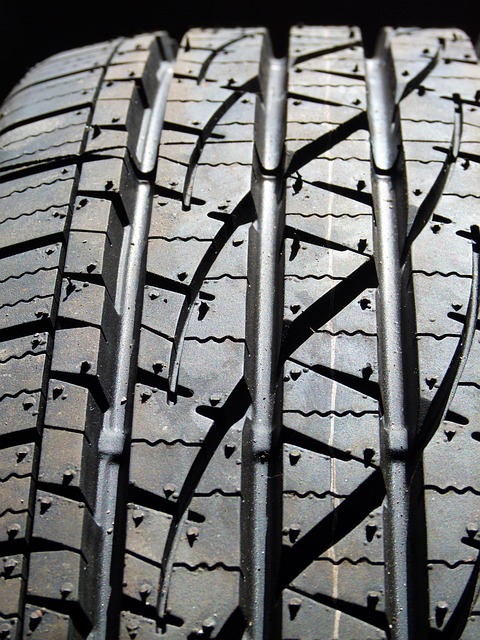
The same mechanism accelerates wear. The cited tire-manufacturer benchmark is that a 10% underinflation reduces tire life by 10–15%. The relationship is not linear because an underinflated tire does not merely roll farther; it bends and scrubs across a wider contact patch, concentrates load at the shoulders, and generates more heat. That combination can produce uneven tread wear, shoulder cracking, and shorter usable tread life. This is why a tire-pressure problem can show up in fuel records before it becomes visible as a tire failure.
Here, the 10% rise is a diagnostic trigger, not a cause or a performance target. A fuel-consumption increase of 10% above the truck’s established baseline—or a comparable 10% increase in tire wear—means something has changed. Possible explanations include pressure loss, alignment problems, or load imbalance. Tire pressure is the first check because it is inexpensive, quickly verifiable, and a common source of the other symptoms. If the readings are correct, the next step is to investigate alignment and load distribution rather than treat the 10% figure as normal operating variation.
For a truck that normally receives weekly pressure checks, a 10% signal should change the inspection routine: check tire pressure daily until the cause is identified and corrected. Record the cold pressure, compare every tire on the axle with the manufacturer’s recommended value, and document fuel and wear changes after correction. The rule is simple: use the signal to increase diagnostic attention, not to reduce it.

Evidence
Michelin Fleet Solutions, in “Tire Pressure and Fuel Savings,” provides a direct fleet-oriented benchmark: a 10% underinflation increases fuel consumption by 1.5–2% and reduces tire life by 10–15%. The practical rule is to treat either result as a reason to inspect tire pressures promptly, record the readings, and correct any tire that does not meet the manufacturer’s recommended inflation level. A fuel-use increase or an unusual wear pattern should be logged by vehicle and tire position so that the next check can determine whether the issue persists after inflation is corrected.
The U.S. Department of Energy’s FuelEconomy.gov, in “Tire Maintenance,” notes that properly inflated tires can improve fuel economy by up to 3.3%. That figure is best used as a potential efficiency opportunity rather than a guaranteed saving. For a fleet, the check should compare the vehicle’s actual fuel consumption with its established baseline, then verify tire pressure before replacing parts or changing operating practices. If consumption remains elevated after the tires are brought to specification, the evidence points toward another cause that should be investigated rather than ending the tire-pressure check.
The European Tyre and Rim Technical Organisation (ETRTO) reports that 20% of trucks on EU roads have at least one tire underinflated. This makes tire pressure a routine condition to screen for across a fleet, not only after a noticeable fuel or wear change. The check should include every tire on the vehicle, including dual tires, because a pressure problem in one tire can affect vehicle operation and be overlooked when attention is focused only on steering or one side of the truck.
These three sources support a consistent evidence-based practice: use the vehicle’s baseline to identify a change, check tire pressure when the signal appears, document the readings, and repeat the check after correction. Michelin quantifies the fuel and wear consequences of underinflation, FuelEconomy.gov identifies the fuel-economy benefit of proper inflation, and ETRTO shows that underinflation is widespread among trucks. Together, they support more frequent pressure checks and careful follow-up when a fleet’s baseline changes; they do not support reducing check frequency or assuming that tire pressure is the only possible explanation.
Options Compared: Check Frequency vs. Cost
When fuel consumption or tire wear rises by 10% from a truck’s established baseline, tire-pressure inspection should become a daily operation until the cause is found and corrected. The decision is not whether extra checks are worth the expense; it is which schedule gives the best chance of identifying pressure loss before it becomes a safety, fuel, or tire-replacement problem.
| Option | Estimated cost | Detection window | Operating result |
|---|---|---|---|
| A: Weekly checks | About €5 per check per truck | Slow leaks may remain undetected for up to 7 days | Suitable baseline when operating normally |
| B: Daily checks after the signal | About €25 per week per truck | Leaks can be identified within 24 hours | Reduces the risk of continued operation on an underinflated tire |
| C: Biweekly checks | About €2.5 per check | Longer interval between inspections | Raises the chance of undetected pressure loss and higher fuel or wear costs |
Option A remains the baseline for trucks whose fuel consumption and tire wear are stable. At roughly 5 per check per truck, weekly inspection adds a predictable operating cost while limiting the time a slow leak can go unnoticed. For a fleet, this schedule also gives personnel a simple routine: inspect each truck at a defined point in the operating week and record the reading alongside the vehicle’s normal performance.
Option B becomes appropriate as soon as the specified performance signal appears. Its estimated weekly cost of 25 per truck is higher than the baseline, but the inspection interval shortens enough to find a leak within 24 hours. That faster detection window gives the driver or technician an opportunity to correct the pressure before the truck continues operating in the condition that triggered the review.
Option C appears attractive on a per-check basis, but the apparent saving is misleading. Less frequent inspections create a longer period in which pressure loss can continue unnoticed, and that can leave the underlying tire condition unresolved. The resulting expense can then appear elsewhere in the fleet accounts through increased fuel use, accelerated wear, roadside assistance, or tire replacement.
Option B is the clear winner after the 10% signal because it combines timely detection with a defined response period. Increase the checks from weekly to daily, keep them at that frequency until the cause is identified and corrected, and document each reading so the truck’s baseline can be compared with its post-repair performance. Once normal readings and operating results are confirmed, the fleet can return the vehicle to the weekly baseline rather than treating reduced inspections as a permanent economy measure.
Costs and Numbers That Matter
Fuel costs make the diagnostic threshold easy to place in euros. A truck consuming 30 L/100 km at 1.50 per liter costs 0.45 per kilometer to operate. A 10% increase in fuel consumption therefore adds 0.045 per kilometer, which becomes 450 across 10,000 km. The practical check is to compare the truck’s current fuel use with its own baseline for comparable routes, loads, and operating conditions. If the difference reaches 10%, daily pressure checks should begin while the cause is investigated; the additional fuel cost is not a reason to reduce monitoring.
Tire replacement provides a separate cost calculation. Using the article's illustrative tire-set cost of approximately 3,000 and the cited 10–15% reduction in tire life from a 10% underinflation, premature replacement can add roughly 300–450, calculated as 10–15% of the tire-set cost. This is a lifecycle expense rather than a single repair bill, so it should be included alongside fuel, roadside assistance, vehicle downtime, and any related safety costs when comparing a temporary increase in check frequency with continuing to operate without closer inspection.
Daily checks for two weeks are estimated to cost about 50 per truck. That amount is small compared with either one avoided tire failure, which may produce a roadside repair bill of 500 or more, or the 450 in additional fuel cost over 10,000 km from a 10% consumption rise. Each outcome alone exceeds the 50 checking cost. The break-even rule is therefore straightforward: if the extra checks help prevent one repair or recover the stated fuel cost, the intervention has a positive return. The calculation supports checking daily until the reason for the 10% signal is identified and corrected, rather than treating the signal as permission to check less often.
For fleet managers, the next action is to record the baseline consumption, the cost per kilometer, and the tire replacement cost for each truck, then calculate the cost of a 10% deviation over the distance traveled. A useful comparison is 50 for two weeks of daily checks against 450 in additional fuel over 10,000 kilometers, 450 in premature tire replacement, or a roadside repair above 500. These figures make the maintenance decision concrete: the check frequency should increase when the diagnostic threshold is reached, and the expense of doing so should be weighed against the cost of leaving the underlying issue unresolved.
What the Evidence Does NOT Establish
A 10% increase in fuel consumption or tire wear is best treated as a heuristic warning, not a universal constant. The threshold is useful because it gives fleets a consistent point to begin investigating, but the same increase can result from changes in payload, routes, traffic, weather, acceleration patterns, idling, or driver behavior. A fleet using per-vehicle fuel monitoring, such as Cartrack’s fleet-management approach, should compare the affected truck with its own recent baseline under comparable conditions before attributing the change to pressure. If load or route conditions have changed materially, record that context rather than treating the percentage as a tire-pressure diagnosis.
The available sources do not establish different pressure-check intervals for long-haul, regional, local-delivery, or other truck types. Nor do they provide a universal interval that accounts for axle load, wheel position, seasonal temperature changes, or duty cycle. The daily response to a suspected pressure-related signal therefore assumes broadly similar operating conditions across the vehicles being compared. For mixed fleets, use the closest comparable truck as the baseline: match its route class, payload range, driver, and typical speed. If no comparable baseline exists, inspect the vehicle immediately and establish a baseline after correcting any identified problem.
There is also no direct basis in the source material for converting a 10% rise into a specific pressure-loss percentage. The relationship is correlational: a pressure problem may coincide with higher fuel use or faster wear, but the observed change does not reveal how much air was lost, where the loss occurred, or whether pressure was the initiating cause. A fleet should not, for example, infer a particular underinflation level from the threshold alone. Instead, record the signal, document the operating conditions, and measure each tire’s pressure using the manufacturer’s cold-pressure procedure.
Continuous or scheduled monitoring can help separate a persistent vehicle anomaly from a one-time operating change. Pneumatica describes scheduled visual and audible inspections alongside continuous sensor readings, while Autotronix highlights anomaly detection and analytics across fuel, consumption, and vehicle-utilization data. Those methods are especially useful when ordinary trip summaries cannot explain the increase. The check is straightforward: compare the same vehicle across equivalent operating periods, identify whether the anomaly persists, and inspect pressure before making broader conclusions.
These limits do not make the 10% rule less useful; they define what it can and cannot establish. It is a screening threshold for increased scrutiny, not proof of causation or a universal maintenance interval. When the signal appears, preserve the baseline comparison, record exceptions such as load or route changes, and investigate the tires without waiting for another cycle of the same magnitude.
From Signal to Action
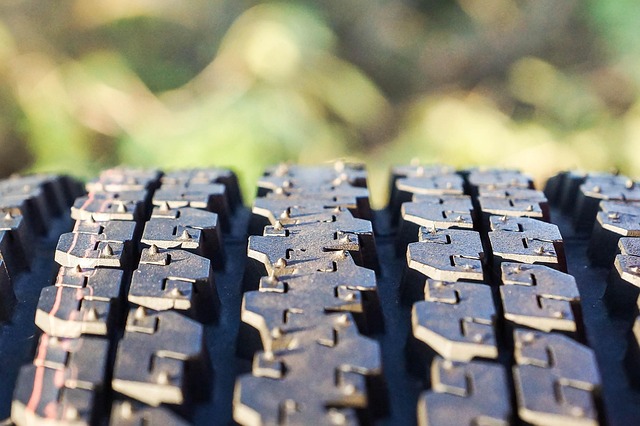
The worked example starts with a truck whose established fuel-consumption baseline is 30 L/100 km. Its current consumption is 33 L/100 km, a 10% increase. Tire wear provides a second signal: the truck’s baseline tread depth is 10 mm, while a tire now measures 9 mm after 20,000 km, indicating 10% faster wear. These readings trigger a diagnostic review; they do not justify returning to less frequent inspections. The truck should move from weekly pressure checks to daily checks until the cause has been identified, corrected, and verified.
Checkpoint 1 is a complete pressure measurement. Record each tire’s cold inflation pressure and compare it with the 100 psi recommendation for the vehicle. The two drive-axle tires measure 90 psi, which is 10% below the recommendation. Check the other tires as well rather than assuming the problem is limited to the axle. Photograph or otherwise document the gauge readings, then compare all results with the vehicle placard or manufacturer specification.
Checkpoint 2 is a leak inspection. Soak each tire’s valve stem and inspect the tire surface, bead area, and wheel for escaping air. The inspection finds a slow leak in one tire losing 1 psi per day. At that rate, an unrepaired tire would fall another 10 psi over 10 days and return to the 90 psi condition even if inflated to 100 psi that day. Repair or replace the leaking tire, inflate it to the specified pressure, and repeat the measurement after the repair.
The following checklist turns the signals into a repeatable maintenance record:
| Checkpoint | Recorded result | Required action |
|---|---|---|
| 1. Fuel-consumption comparison | 30 L/100 km baseline; 33 L/100 km current | Mark the 10% rise as a diagnostic trigger |
| 2. Tread-wear comparison | 10 mm baseline; 9 mm after 20,000 km | Include tire condition in the investigation |
| 3. Pressure measurement | Drive-axle tires at 90 psi; 100 psi recommended | Check every tire and record all readings |
| 4. Leak inspection | Slow leak identified: 1 psi/day loss | Repair or replace, inflate to specification, and verify |
| 5. Follow-up | Cause corrected and pressure verified | End daily checks only after verification; otherwise continue them |
Use the checklist at the start of each daily check while the investigation remains open. Confirm that the repaired tire holds pressure, remeasure the full set, and retain the readings for comparison with the next fuel and tread observations. This approach follows the fleet-monitoring practice described by Autotronix: compare performance for each vehicle and investigate excessive consumption systematically. For this truck, the operating rule is straightforward: increase checks when the 10% signal appears, continue them until the cause is corrected, and never reduce check frequency because a reading improves temporarily.
Worked Example: Run the Numbers
This worked example uses illustrative numbers only. A regional truck fleet establishes a baseline of 100 gallons of fuel consumed and a tire-wear index of 100, with each tire recorded at 100 PSI. Tire pressure is normally checked once a week. The fleet uses per-vehicle fuel monitoring, consistent with the method described by Cartrack, and records wear by axle and tire position.
During the next illustrative period, fuel consumption reaches 110 gallons. The calculation is 110 gallons minus the 100-gallon baseline, divided by the 100-gallon baseline: (110 − 100) ÷ 100 = 0.10, or a 10% increase. The tire-wear index also reaches 110, producing the same result: (110 − 100) ÷ 100 = 0.10. This is an illustration of the trigger calculation, not a claim that every fleet will consume exactly 100 gallons or record a wear index of 100.
| Illustrative measure | Baseline | New reading | Change | Calculation |
|---|---|---|---|---|
| Weekly fuel consumption | 100 gallons | 110 gallons | 10% | (110 − 100) ÷ 100 |
| Tire-wear index | 100 | 110 | 10% | (110 − 100) ÷ 100 |
| Pressure checks in one week | 1 | 7 | 6 additional checks | 7 − 1 |
Because either measured change reaches the rule’s 10% trigger, the fleet manager increases pressure checks from weekly to daily for the next operating week. Seven daily checks replace one weekly check, creating six additional opportunities to identify a tire that needs attention. The maintenance lead records the PSI reading for every tire, which allows a low reading to be compared directly with the 100-PSI baseline used in this example.
Daily checking is the winner for this example. Its break-even trigger is the 10% signal itself: once the calculated increase reaches 10%, adding checks is justified before a cause is known. The fleet continues daily checks until the cause is identified, the affected tires are corrected as needed, and subsequent measurements return to the established baseline. If the readings fall back below 10% and the underlying issue has been corrected, the fleet may resume its baseline weekly schedule. The calculation therefore changes the response to a measured signal; it never reduces the trigger or delays the first daily inspection.
Decision Rules for Fleet Managers
Rule 1: If fuel consumption rises 10% or more from the truck’s established baseline, increase tire-pressure checks from weekly to daily for seven days. Record each reading, the date and time, the tire’s position, the recommended pressure for that vehicle and axle, and any corrective action. Compare readings across the full seven-day period rather than drawing a conclusion from a single low-pressure finding. The 10% result authorizes more frequent monitoring; it does not justify reducing checks or waiting for the next scheduled inspection.
Rule 2: If tire wear rises 10% or more from the vehicle’s normal wear pattern, also check tire pressures daily for seven days and log the results. Capture which tires show accelerated wear and whether the pattern is concentrated on one axle, on one side of the truck, or across multiple positions. Consistent readings and wear locations help the fleet manager distinguish a tire-pressure issue from a pattern requiring another mechanical or operational investigation.
Rule 3: If any tire is found more than 10% underinflated relative to its specified pressure, correct the condition by inflating the tire to the proper pressure and repairing the cause of the pressure loss when a leak or other defect is identified. Continue daily pressure checks until the tire remains at the specified pressure for three consecutive days. Use the same tire, same axle, and the vehicle’s appropriate pressure reference each day so that “stable” means the tire is holding pressure, not merely that it was topped off once.
Rule 4: If no pressure issue is identified after seven days of daily checks, return the truck to the normal weekly inspection schedule and investigate other likely causes, including alignment, load distribution, and driver behavior. Preserve the seven-day pressure log as part of the maintenance record. This transition should occur only after the pressure-related trigger has been cleared; the initial 10% signal should never be used to justify fewer checks during the diagnostic period. If readings fluctuate, pressure loss recurs, or underinflation remains above 10%, continue the daily checks and treat the issue as unresolved.
What to do next
| Step | Action | Why it matters |
|---|---|---|
| 1 | Compare the truck’s current fuel consumption with its established vehicle baseline. | Establishes whether the 10% signal is present. |
| 2 | Compare the truck’s current tire wear with its established vehicle baseline. | Identifies whether the 10% signal also appears in wear. |
| 3 | Move tire-pressure checks from weekly to daily when either the 10% fuel-consumption signal or the 10% tire-wear signal appears. | More frequent checks help reveal possible pressure loss. |
| 4 | Keep tire-pressure checks daily while investigating and correcting the increase. | The daily interval continues until the trigger is resolved. |
| 5 | Return to weekly tire-pressure checks only after the fuel-consumption or tire-wear increase has been identified and corrected. | Frequency should not be reduced while the diagnostic signal remains unresolved. |
| 6 | Never reduce tire-pressure check frequency in response to the 10% signal. | The 10% increase calls for closer monitoring, not fewer checks. |
Frequently Asked Questions
What should I do if my truck’s fuel consumption rises by the 10% signal?
Move from weekly to daily tire-pressure checks until the cause is identified and corrected.
How often should I check tire pressure after abnormal tire wear is detected?
Check tire pressure daily until the cause of the wear increase is resolved.
Should I check tire pressure less often if fuel consumption rises?
Never reduce tire-pressure check frequency.
What baseline should I use to decide whether fuel consumption has reached the 10% trigger?
Compare the truck’s current fuel consumption with its baseline.
What baseline should I use to decide whether tire wear has reached the 10% trigger?
Compare the truck’s current tire wear with its baseline.
Why can underinflation increase a truck’s fuel consumption?
As a tire loses air, greater sidewall deformation and heat increase rolling resistance, requiring the engine to burn more fuel.
Quick answers
| What should a driver do when a truck’s fuel consumption rises by the stated threshold? | Move from weekly to daily tire-pressure checks until the cause is corrected. |
| What should a driver do when a truck’s tire wear rises by the stated threshold? | Compare the tire wear with the truck’s baseline and move from weekly to daily tire-pressure checks until the cause is corrected. |
| How long should daily tire-pressure checks continue after the increase is detected? | Daily checks should continue until the trigger is resolved. |
| Should tire-pressure check frequency ever be reduced in response to the increase? | Never reduce tire-pressure check frequency. |
| How does underinflation cause a truck to use more fuel? | As a tire loses air, its sidewalls flex more, creating greater deformation and heat that increases rolling resistance and requires the engine to burn more fuel. |